Exploring Infinity
And now, at last, we begin our exploration of one of the most amazing objects in all of mathematics – the famed Mandelbrot Set. Let us discover the infinite beauty… of algebra!
Click mouse to Zoom In <Ctrl>-Click mouse to Zoom Out Add <Shift> to Zoom faster
Play with the fractal above for a while. Explore the details on the edge. You can find (literally) countless examples of Self-Similar patterns within the Mandelbrot Set. But interestingly, unlike the simple IFS fractals from the previous chapter, which show the same kind of detail everywhere, at all scales, the Mandelbrot Set is NOT perfectly self-similar. The styles of the objects from different parts of this fractal are dramatically different. Furthermore, the patterns can actually GAIN in complexity and beauty the deeper you explore.
One of the most spectacular discoveries in the Mandelbrot Set is that as you zoom into it, you can find an infinite number of tiny copies of the entire object. And every one of these replicas is just as complicated as the original, and you could explore the details around the edge of a replica as well. And then of course, you can find even smaller replicas, around the replicas, and so on. <Ctrl>-click to zoom out of the replicas above to discover where in the main Mandelbrot Set they come from.
Amazingly, while there is an infinite diversity of shapes and patterns in the Mandelbrot Set, the rules that govern the way the shapes behave are universal. We will explore some of the structural rules that operate within this fractal, which will shed light on the complex behavior of simple equations. You will also be able to predict what shapes you will find in different areas, and how they connect, branch, twist and interact, allowing you to discover virtually any fractal pattern you can imagine.
 |  |
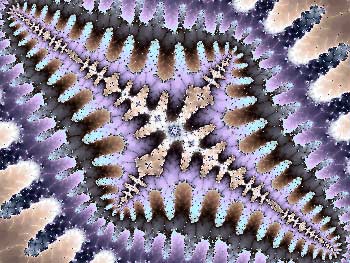 | 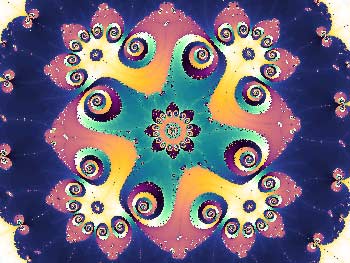 |
| Ultra-deep details from within the Mandelbrot Set. Images range from a depth of 1074 magnification to deeper than 10245 power. Images courtesy of Jonathan Leavitt, Affiniteaser Emergent. | |
Handling the Scale
The four images above are all inconceivably tiny details from different areas deep within the Mandelbrot Set, and are far smaller than anything in the real universe. (And they are all connected!) To manage the sizes of these mathematical objects, we must use Exponential Notation, which allows us to easily manipulate gigantic and miniscule numbers.
A reasonable estimate for the size of the universe is 100 billion light years, or roughly 1027 meters. At the other end of the range, the smallest theoretical scale – known as the Planck LengthREF – is approximately 10-35 meters. To find the difference in scale, we simply subract the exponents: 27 – (-35) = 62 orders of magnitude! This is the entire range of scale from the smallest to the largest in our universe.
To put that number in perspective,
103 is a thousand,
106 is a million,
109 is a billion,
1012 is a trillion.
1024 is a trillion trillion
1036 is a trillion trillion trillion
So 1062, the range from the smallest to the largest scales in physics, is actually much smaller than the scale of the images shown above. The range of scale between the whole Mandelbrot Set and the zoomed-in detail at the top right, which is magnified 1074 times is 1012, or a trillion times bigger than the whole scale of our universe. And yet these incredibly tiny images just barely scratch the surface of the infinite Mandelbrot Set.
Question:
The deepest of the four images above, on the top left, is magnified 10245 times.
How much larger is this fractal image then that on the top right, at 1074? Give the exponenent: [ ]
How much larger is this deepest image then the entire universe? Give the exponenent: [ ]
Next, you will learn your way around the Mandelbrot Set…
Learning Your Way Around
The Spiraling Rule
When you explore any of the valleys in between the main body and the circular bulbs, you will find spirals. The four images below show a sequence of zooms into the main valley that divides the ‘head’ and the ‘body’ of the Mandelbrot Set. This area is often called the Seahorse Valley.
| Click mouse to Zoom In <Ctrl>-Click mouse to Zoom Out Add <Shift> to Zoom faster | |
The deeper we venture down the crevice of the Seahorse Valley, the more tightly twisted the spirals become. We can try to zoom into the spot where the head and the body join, at the horizontal X-axis, but we can never get there. The following four images show a variety of spirals that come from successively deeper down the Seahorse Valley, and which twist tighter and tighter. Where the Seahorse Valley meets the X-axis, the spirals twist infinitely tightly!
This Spiraling Rule is universal – it applies to all the valleys underneath all the bulbs on the Mandelbrot Set.
Activity:
Explore the valley between the ‘Period 3’ bulb, above, and the main body. The spirals to the left of the junction point where the bulb joins the body twist in one direction, whereas the spirals on the right of this point twist in the other direction.
Verify this by zooming into spirals in the valleys on both sides of the junction point.
Verify that the same twisting rule applies in the valleys of the Period-3 bulb, i.e. the spirals are more twisted the deeper you go down the valley.
Why do think we call the Period-3 bulb by that name?
We’ll learn more about the periods of the various bulbs in a few lessons, but first, we’ll learn about Bifurcation…
Learning Your Way Around
The Branching Rule
As you venture deeper into the Mandelbrot Set, you will often encounter a progression illustrated below, in which the symmetry doubles from two arms to four arms to 8 arms to 16, etc… The technical name for this behavior is Bifurcation, and it is one of the most fundamental elements of fractals and chaos.
| A sequence of zooms into the spike at the far left of the Mandelbrot Set, showing 2 arms bifurcating into 4, which then bifurcate into 8 arms, etc. Click mouse to Zoom In <Ctrl>-Click mouse to Zoom Out Add <Shift> to Zoom faster | |
This Bifurcation or doubling rule is universal, so it applies everywhere in the Mandelbrot Set.
<Ctrl>-click the image below to zoom out and see the sequence of bifurcations in reverse from a different location.
Did you find where in the Mandelbrot Set that detail came from? Have you observed that at the bottom of the sequence of doubling there is always a little replica of the entire Mandelbrot Set? This is an amazing discovery! In the next chapter we will explore these little copies of the Mandelbrot Set in more detail.
But first we will learn about the Periodicities of the Mandelbrot Set.
Learning Your Way Around
Periodicity
Click mouse to Zoom In <Ctrl>-Click mouse to Zoom Out Add <Shift> to Zoom faster
In the Mandelbrot Set above, we have labeled some of the Periodicities of the major bulbs. Click on the bulb at the top, labelled ‘3’ to explore its structure. Note that all of the branches coming out of this bulb have a three-arm structure.
Zoom back out and then zoom into the bulb to the left of the Period 3 bulb and explore the one labelled ‘5’. This is the Period 5 bulb, and all its branches have a 5 arm structure.
Continue exploring the bulbs down into the Seahorse Valley (counterclockwise) and you will find the Period 7, Period 9 and Period 11 bulbs labeled. This progression continues down the valley, where the Period number, or Periodicity, increases by two for every bulb in the progression.
The figure on the left, above, has a periodicity of 13.
Question:
What is the periodicity of the bulb in the figure on the right? [ ]
Learning Your Way Around
The Progression of Periodicities
Click mouse to Zoom In <Ctrl>-Click mouse to Zoom Out Add <Shift> to Zoom faster
Now let’s explore the bulbs on the right side of the Period 3 bulb. Progressing clockwise, we find a different sequence of periodicities. On this side, the periodicities increase in a simple fashion, 3,4,5,6,7,8, etc.
The figure on the left, above, has a periodicity of 8.
Question:
What is the periodicity of the bulb in the figure on the right? [ ]
Let’s look at the periodicities of the bulbs in order. Starting with the main body, which is the Period 1 bulb, find the next largest bulb. This is the Period 2 bulb on the left. The next largest bulb is the Period 3 bulb at the top. Continuing clockwise we have the rest of the orderly sequence, 4,5,6,7,8,9, etc…
Learning Your Way Around
Adding Periodicities
Click mouse to Zoom In <Ctrl>-Click mouse to Zoom Out Add <Shift> to Zoom faster
Now we’re going to explore the periodicities of the bulbs in between any two bulbs. There is a simple and elegant rule:
The periodicity of the largest bulb in between any two bulbs is the sum of the surrounding bulbs’ periodicities.
So the largest bulb between the Period 3 bulb and the Period 5 bulb has a periodicity of 8. Zoom into the bulb labeled ‘8’ and count the arms to verify that this is the case.
Likewise, the largest bulb between the Period 5 and the Period 7 bulb is 12. Verify that this is also true.
Does this same rule apply on the other side of the Period 3 bulb, where the periodicities increase by 1 for each major bulb? Find out below!
Click mouse to Zoom In <Ctrl>-Click mouse to Zoom Out Add <Shift> to Zoom faster
Questions:
What is the periodicity of the largest bulb in between the Period 3 and the Period 4 bulbs [ ]
What is the periodicity of the largest bulb in between the Period 4 and the Period 5 bulbs [ ]
What is the periodicity of the largest bulb in between the Period 5 and the Period 6 bulbs [ ]
The numbers at the bottom of the Mandelbrot window show the location and magnification of the image. (X,Y,mag)
Paste in the X and Y coordinates of the the Period 10 bulb: [ ]
Next, we will put together the rules we’ve learned so far to allow you to discover patterns within the Mandelbrot Set that have any desired periodicity, branching and twistedness.
Notice how there are two distinct Period 5 bulbs, one in the main clockwise progression of periodicities, and one in the Seahorse Valley. The same is true for the Period 7 bulbs, and Period 9, etc.
Next we will learn about the bulbs in between the bulbs, and how to predict their periodicities.
Learning Your Way Around
Putting It All Together
Now that you understand the progression of periodicities and how to add periodicities together, you can find any periodicity you wish. Let’s explore the decorations of Period 10 bulb, below.
Next we can apply the Spiral Rule. If we want to find a twisted version of this 10-armed pattern, just zoom down into the valley between the Period 10 bulb and the main body.
Verify that this structure still has 10 arms (though they’re harder to count when they’re so twisted).
If we zoom into the connections between any of the self-similar subunits in the picture above, we can apply the Bifurcation Rule, as illustrated in the sequence of four images below:
| A sequence of zooms into the period 10 bulb, showing the bifurcation progression from 2 arms to 4 arms to 8 arms to 16 arms, etc. | |
The rules you’ve learned about Spiraling, Bifurcation, and Periodicities can be applied anywhere in the entire Mandelbrot Set. For example, you could discover a 64-fold symmetric version of a highly twisted Period 23 object.
Fractivity:
Download the amazing and FREE open-source program XaoS which will allow you to explore the Mandelbrot Set (and other fractals) in more detail and with much more control.
Play with this program during the rest of this course. Explore the online tutorial and the many powerful features of the program. Don’t be scared – it’s easy to use – just point and click to zoom in!
Your term project is to create the most interesting and beautiful fractal you can. Submit both the image and the fractal file by email by the end of the term.
In the next chapter, we will learn how an extremely simple equation creates the Mandelbrot Set…
From the Simple to the Complex
In this chapter, you will learn the algebraic equation that generates the Mandelbrot Set. In order to understand how the equation creates the beautiful images, we will need to understand the process of iteration, and learn a little bit about Complex Numbers.
Iteration
One of the truly incredible lessons to learn in the study of fractals is that infinitely complex patterns can be created by repeating a simple process. This occurs in natural fractals over a small range of scales, for example in the repeated branching of a tree. To generate the Mandelbrot Set, we use a computer program to calculate a simple equation over and over. Because we can iterate the equation as many times as we want, the fractals we create this way can be arbitrarily detailed, meaning we can zoom in as deep as we like.
Take the equation below. When we iterate this equation (calculate it over and over again), we generate the amazing Mandelbrot Set. To calculate the original image at the resolution of your screen, we only need to iterate the equation a few dozen times before it comes into focus. But to explore some of the super-deep images, we may need to compute the equation millions or even billions of times.

The way we interpret this iterated equation is that the new value of a variable Z equals the old value of Z, squared, plus a constant, C. The arrows tell us that we take the answer and plug it back into the equation again, get a new answer, plug it in again and repeat this process many times.
Formally, we write the equation like this:

In this system, the letter ‘n’ is a counter that keeps track of which iteration we are computing. In practice, n starts at 0 and increments to 2,3,4,5,6 etc and goes as high as we need in order to produce the image. Zn+1 equals the next value in the cycle of iteration, based on the previous value of Z.
In general, we start with the variable Z = 0, and we are looking to discover what happens to this equation when we plug in different values of the constant ‘C’.
Outcome 1
Let’s see what happens if we plug in a value of C = 1.
| Z1 = Z02 + C = 0 + 1 = 1 Z2 = Z12 + C = 1 + 1 = 2 Z3 = Z22 + C = 4 + 1 = 5 Z4 = Z32 + C = 25 + 1 = 26 Z5 = Z42 + C = 676 + 1 = 677 etc… |  |
Outcome 2
Generally, when you square a number (multiply it by itself), it tends to get bigger. And as the equation keeps iterating, the numbers often get very big quickly. Most starting values of C will eventually go to infinity. But not all of them! Some starting values of C will cause the value of the equation to get smaller and smaller. For example, let’s see what happens with C = -.5
| Z1 = Z02 + C = 0 + -0.5 = -0.5 Z2 = Z12 + C = 0.25 + -0.5 = -0.25 Z3 = Z22 + C = 0.0625 + -0.5 = -0.4375 Z4 = Z32 + C = 0.1914 + -0.5 = -0.3086 Z5 = Z42 + C = 0.0952 + -0.5 = -0.4048 Z5 = Z42 + C = 0.1638 + -0.5 = -0.3362 Z5 = Z42 + C = 0.1130 + -0.5 = -0.3870 Z5 = Z42 + C = 0.1498 + -0.5 = -0.3502 etc… |  |
Eventually this progession ends up converging on a number somewhere between -0.35 and -0.38. In the words of Dynamical Systems we call the path taken by the value of Zn its orbit. We call the fixed point -0.366 an attractor, because it attracts the orbit of the equation.
Outcome 1
There is one other possible outcome for cerain starting values of C: the value of Z may alternate between two or more fixed points. For example, let’s try C = -1.
| Z1 = Z02 + C = 0 + -1 = -1 Z2 = Z12 + C = 1 + -1 = 0 Z3 = Z22 + C = 0 + -1 = -1 Z4 = Z32 + C = 1 + -1 = 0 Z5 = Z42 + C = 0 + -1 = -1 etc… |  |
We are interested in the fate of Z for different starting values of C. The first case illustrated above has the value of Z go to infinity. The last two cases have the value of Z stay finite.
DEFINITION: The Mandelbrot Set is the collection of all starting values C that stay finite when iterated through the equation Zn+1 = Zn2 + C

To really understand how the equation turns into the images of the Mandelbrot Set, we’ll need to learn about Complex Numbers, which exist as points in a 2-Dimensional plane…
From the Simple to the ComplexComplex NumbersIn the last section we iterated the simple equation Zn+1 = Zn2 + C , starting with the numbers C=1, C=-0.5, and C=-1. We found that the fate of these starting points can be very different: The output of the equation can grow to infinity, it can shrink to a fixed value, or it can alternate stably between two or more fixed values.  The Complex Plane, showing a point ‘C’ with a value 1 + 2i. Although they are not entirely ‘real’, it turns out that Complex Numbers are very useful in a wide variety of applications, including, physics, engineering, and even art. The Mandelbrot Set is made from the equation Zn+1 = Zn2 + C where Z and C are Complex Numbers. In order to be able to compute this equation with Complex Numbers, we must be able to do simple arithmetic like addition and multiplication with them. Fortunately, this turns out to be quite simple, and is illustrated below. Complex AdditionTo add two Complex Numbers, we simply add the Real components with the Real componenets and the Imaginary components with the Imaginary. So for instance, if P = -1 + i and Q = 2 + i, then P + Q = 1 + 2i We can also look at these points in the Complex Plane as vectors, or arrows pointing from the origin to the point. In this way of looking at Complex Numbers, we can add them by connecting the vectors in a parallelogram.  The new point P+Q can be found by adding the compnents of P and Q, or by connecting the vectors. Complex MultiplicationIt is also possible to multiply two points in the Complex Plane. It is much more convenient to multiply complex points in Polar Coordinates, where we define a point with an angle and a distance from the origin than it is to do the same operation in Cartesian Coordinates, where a point is defined as an (X-Y) pair. To multiply points in Polar Coordinates, we just add the angles of the two vectors, and we multiply their lengths.  Two complex points P and Q can be multiplied to form a new point and vector. When we calculate the Mandelbrot Set equation, we need to square the complex number Z. To do this, we’re simply multiplying Z x Z, which by the rule given above just means doubling the angle and squaring the length of vector. 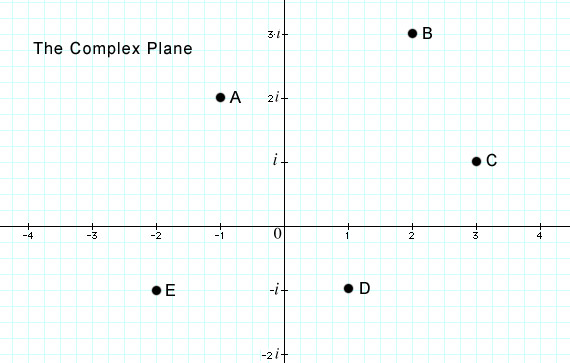 Point B = [ ] Point C = [ ] Point D = [ ] Point E = [ ] What is the value of A+C? [ ] What is the value of C+D? [ ] What is the value of D+E? [ ] What is the value of E+B? [ ] Bonus Question: What is the value of (0+2i) squared? [ ] Now that you have seen the concept of iterating an equation, and understand the 2-Dimensional coordinate system we’ll use, we can move into the next section. We’ll see what happens when we iterate the equation Zn+1 = Zn2 + C and look at the fates of various starting values of the complex point C. From the Simple to the Complex
We will now see what happens to various Complex points ‘C’ when we iterate them through the equation Zn+1 = Zn2 + C. This exploration will explain the concept of Periodicity Periodic Orbits
Click in the left panel to choose a value of C, represented by a white cross. The right panel shows the points that represent the evolving value of Z for the chosen value of C. If you check the ‘Points’ checkbox, it will draw a dot at every point that Z passes through. Uncheck the ‘Animate’ checkbox if you want to instantly see the behavior of a single point instead of animating the journey to that point Use the arrow keys to nudge the cursor by one pixel at a time. Click on the image above which lies in the Complex Plane. Play around with the applet. Wherever you click in the left panel, you are choosing that Complex value for C and iterating it through the equation. The right panel shows the Orbit, or trajectory of the value of Z as the equation is iterated 100 (?) times. Click in the black area inside the main body of the Mandelbrot Set, and you can see the orbit converge to a finite value. Click just outside the edge of the Mandelbrot Set somewhere, in the colored area, and you will see the orbits diverge, and spiral away to infinity. Try clicking inside and around some of the bulbs attached to the main body. Look for certain shapes in the orbit pathways, triangles, squares, pentagons, star shapes, etc. PeriodicitiesClick inside the Period-3 bulb (See the map in Chapter 3 if you’ve forgotten where that is) and describe the shape made by the orbit of Z. You should see a triangle. We call this the Period-3 bulb because the value of Z behaves periodically, returning to the same point every 3 iterations. If you visit the next large bulb over, to the right, you will find the Period 4 bulb, in which the orbits follow a square trajectory. Continuing clockwise down the large valley on the right, you’ll encounter pentagonal behavior in the Period 5 bulb, you’ll find hexagonal orbits in the Period 6 bulb, and you can continue all the way down the valley, discovering ever higher-order polygons, corresponding to the periodicities of the bulbs. Return to the Period-3 bulb, and explore in the clockwise direction this time. You’ll come to the Period-5 bulb, but this time, instead of a simple pentagonal orbit, you’ll see that the vlue of Z follows a star-shaped pathway. The same is true for the Period-7, Period-9 etc bulbs, all the way down the Seahorse Valley. Interestingly, the major bulbs in this region have only odd-numbered periodicities, which makes some sense, since the simple star-shaped orbit requires an odd number of points. Twisting<Alt>-click to zoom in near the Period-3 bulb. Click in the main body, just below the Period 3 bulb, and you will see a triangular tunnel in the orbit diagram, converging on the stable point inside the bulb. As you move your mouse to the left or right of the center, you can see the triangular tunnel twist to the left or right. This is a demonstration of the Spiraling Rule seen at the level of the orbits.
From the Simple to the Complex
Click mouse to choose a value of “C” <Alt>Click mouse to Zoom In (either panel) <Ctrl>-Click mouse to Zoom Out. Use the arrow keys to nudge the cursor by one pixel at a time. Sensitivity to Initial ConditionsOne thing that we can easily observe is how sensitive this system is. Zoom in a few times to find somewhere interesting, and place the cursor somewhere very close to the edge of the Mandelbrot Set. Uncheck the “Animate’ checkbox. Use the arrow keys to nudge the cursor one pixel at a time, and you will sometimes see abrupt and radical changes in the orbit diagram in the right panel. We are comparing the orbits for two very similar values of C, and it is apparent that no matter how close our two starting points may be, the orbits may have radically different outcomes. Indeed, being infinitely complex, we can never zoom in all the way to the edge. We can go arbitrarily deep, and still find that one point may have a finite orbit while a neighboring point infinitesimally close by may have an orbit that goes to infinity. The deeper we go to explore the edge, the more iterations it will take before we can determine the fate of the starting point. This type of behavior that can change abruptly when we nudge the starting value a small amount is an example of Sensitivity to Initial Conditions, a key concept in Dynamic Systems, the foundation of fractals, and one that we will revisit in Chapter 6, on Chaos. Iteration ArtifactsNote: If we stop iterating too soon and give up before the point reaches some threshold and spirals outward, we will mistakenly assume this starting point belongs inside the Set, and so it will be colored black, even though it actually should belong outside the Set. Whatever magnification we’re looking at, if we compute the Mandelbrot Set with a finite number of iterations (as we must) our pictures can only be approximations to the ideal, perfect object. Our estimate will always be a little bigger than the actual Mandelbrot Set, as there will always be some points that are really outside the Set but that don’t escape before we give up iterating. This means that the deeper we explore, the more iterations we must compute, and the slower it becomes. (The numbers also gain decimal places and get slower for that reason as well.) No matter how fast our computers ever become, we will always be able to generate fractals that push the limits of what they can do. There is an artistic motivation as well as a sense of curiosity that drives us deeper, as the complexity and beauty of the patterns often increase dramatically with depth. For this reason, when it comes to fractal computing, faster is better! 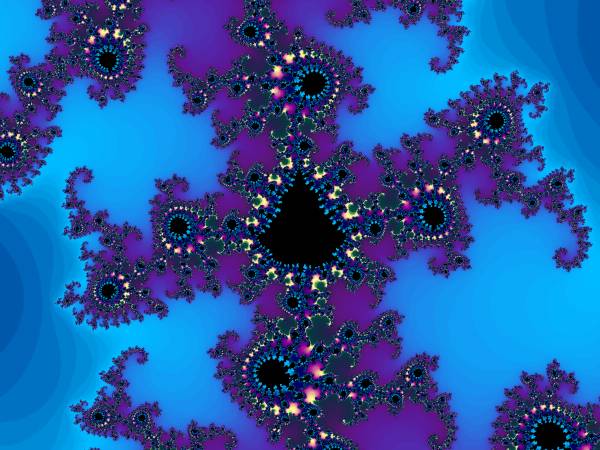 An “undercooked” Mandelbrot Set that has been computed with insufficient iterations, in this case 166.
| ||
Mandelbrot MagicThere are many amazing discoveries about the Mandelbrot Set in store. In this chapter, we will explore the fantastic family of the Julia Sets, the perfectly self-similar jewels that are intimately related to the Mandelbrot Set. We’ll learn how Julia Sets can be connected or disconnected, how these relate to the Mandelbrot Set, and how the Julia Sets can be seen as “Basins of Attraction”. Then we’ll discover “Virtual Julia Sets” embedded in the Mandelbrot Set. We’ll also see what happens when we start playing around with the equations that generate these fractals. We’ll change the exponents, we’ll perturb the starting value of Z as well as C, and finally we’ll see some entirely distinct equations that nonetheless generate the Mandelbrot Set, in the phenomenon known as Universality. Julia SetsClick in the Mandelbrot Set in the left panel to see the associated Julia Set in the right panel. Use the arrow keys to nudge the cursor by one pixel at a time. <Alt>-click inside either window to zoom in, <Ctrl>-click to zoom out. Every point C in the plane of the Mandelbrot Set (above left) has an associated Julia Set (right panel). Click in the black area in the Mandelbrot Set in the left panel above. Explore the shapes of the Julia Sets in the right panel that correspond to various parts of the Mandlebrot Set. The Fundamental Distinction – the two kinds of Julia SetsNotice that when you click a point inside the Mandelbrot Set, the Julia Sets are black shapes with a self-similar ‘coastline’ edge, whereas when you click somewhere outside the Mandelbrot Set, the corresponding Julia Sets are fragmented into many self-similar islands. It is the set of all values of C that generate connected Julia Sets. Every Julia Set is exactly self-similar across scales, while the Mandelbrot can gain in complexity as you venture deeper. 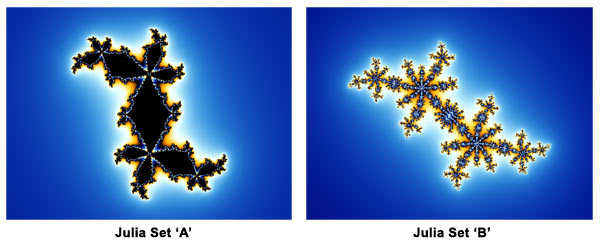
The Mandelbrot – Julia SimilarityExplore deeper in the Mandelbrot Set by <Alt>-clicking in the left panel somewhere near the edge of the Mandelbrot Set. After zooming in, explore the different Julia Sets from just inside and outside the border of the Mandelbrot Set. Observe the equisite sensitivity near the border: A point C just inside the Mandelbrot Set creates a connected Julia Set, while a point just outside the Set creates disconnected Julia Sets. As you zoom deeper into the edge of the Mandelbrot Set, watch the behavior of the Julia Set. Wherever you zoom into the edge of the Mandelbrot Set, the Julia Set begins to take on the same appearance as the local area of the Mandelbrot Set. As you go deeper, the Mandelbrot Set and the Julia Set from the corresponding location begin to resemble each other more and more closely. The only places where this is not true are the tiny replicas of the Mandelbrot Set which never appear in the Julia Sets. Observe the relationship between the orbit diagram and the Julia Set. Wherever there’s a black island-like Julia Set, the orbits are closed, that is, they stay finite. Wherever the Julia Sets are colorful – and disconnected – the orbits fly away to infinity. Basins of AttractionYou may be wondering: What exactly are the Julia Sets? They are based on the identical equation as the Mandlebrot Set: Zn+1 = Zn2 + C
However, instead of looking at the fates of all the starting values of C, as we do in the Mandelbrot Set, we choose ONE value for C, and ask what happens for different values of Z. (Remember, in the Mandelbrot Set, we start with Z = 0. but in the Julia Sets, we’re testing the fate of all starting values of Z, for a given value of C.) For the connected Julia Sets (where C is inside the Mandelbrot Set), all the starting values of Z in the black, connected area will stay finite, whereas the starting values of Z from outside the black area will go to infinity. Mandelbrot MagicHigher Order ExponentsNow that you understand a litlle bit about the functioning of the Mandelbrot Set, we can start to change the equation and explore what happens to the resulting fractal image. Below you will find the Mandlebrot Set and Julia Sets for Z2 + C followed by the Mandelbrot Set and Julia Sets that result from iterating Z4 + C. That is, Z * Z * Z * Z + C. Recall that in polar coordinates, squaring a number just means doubling the angle and squaring the distance of the point from the origin. Raising a complex number to the 4th power simply means quadrupling the angle and multiplying the distance of the point to the origin by itself four times. In both cases, the new point is rotated around the origin, and scaled. Zn+1 = Zn2 + CZn+1 = Zn4 + C
Explore the Z4 Mandelbrot Set and Julia Sets above by <Alt>-clicking in the windows to zoom in. Observe that all the same relationships apply with the Z4 system as you’ve learned about with the Z2 equation. For instance, the Bifurcation Rule applies, but in the Z4 Mandelbrot Set, the branches always quadruple in number, from 4 arms to 16, 64, 256, etc. SymmetryExplore the symmetry of the Mandelbrot Sets and Julia Sets above. The Z2 Mandelbrot Set has one line of symmetry: it is reflected around the horizontal X-axis. The Z2 Julia Set however, has two axes of symmetry: it is made of two copies of the same shape, rotated around the origin. We call a black, connected Julia Set a “Basin of Attraction”, because any value of Z inside the black area is attracted into a stable, finite orbit. All other starting values of Z are repelled, and orbit away to infinity. In the next section, we’ll observe the strange phenomenon of “Virtual Julia Sets” embedded in the Mandelbrot Set. Mandelbrot MagicVirtual Julia Sets
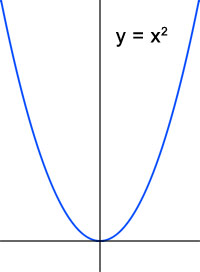
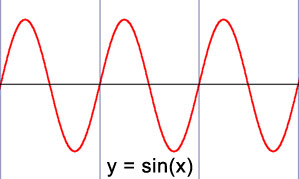
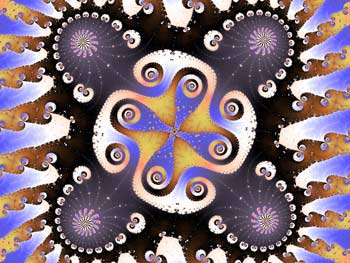
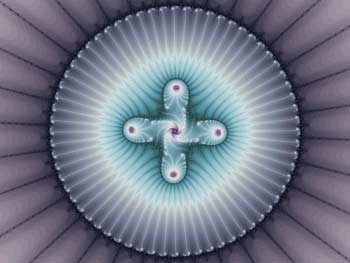
Click mouse to Zoom In <Ctrl>-Click mouse to Zoom Out Add <Shift> to Zoom faster Click mouse to Zoom In <Ctrl>-Click mouse to Zoom Out Add <Shift> to Zoom faster Zoom into the points labeled A,B, and C in the panel above to explore the virtual Julia Sets surrounding a Mandelbrot replica. Notice how the virtual Julia Set resembles an actual Julia Set from the corresponding point in the entire Mandelbrot Set. And yet it is just assembled from parts of the Mandelbrot Set organized in the shape of a Julia Set. The closer you explore to the edge of the replica Mandelbrot Set, the more the virtual Julia Sets will resemble the real ones. Mandelbrot MagicPerturbationTo ‘perturb’ means to slightly alter the normal functioning of a system in some way. Perturbation can shed light on the inner functioning of systems. As an illustration, consider a pendulum, which is in a state of stable equilibrium. Perturb it by poking it slightly, and it will return to its original position. By contrast, imagine a rigid pendulum balanced upsidedown. This is in a state of unstable equilibrium, so that when you perturb it with a slight push, it will fall over. In this section we will see alter the normal functioning of the Mandelbrot Set by making small, deliberate changes to the starting conditions, and seeing what happens after hundreds of iterations. As we commonly find when studying fractals, small changes can result in some big differences! When we generate the Mandelbrot Set, we take the equation Zn+1 = Zn2 + C and ask what happens to Z for all the different startng points C in the complex plane. Z1 = Z02 + C = C Z2 = Z12 + C = C2 + C Z3 = Z22 + C = (C2 + C)2 + C Mandelbrot MagicUniversalityIt is one of the most amazing discoveries in the realm of mathematics that not only does the simple equation Zn+1 = Zn2 + C create the infinitely complex Mandelbrot Set, but we can also find the same iconic shape in the patterns created by many other equations. In fact, the phenomenon of Mandelbrot Universality means that anytime we iterate a function that in some portion, at some scale, resembles the parabolic function Z2, then we will find small copies of the Mandelbrot Set in the map of that function. Let’s see what this looks like. When we plot the basic function that generates the Mandelbrot set, Z2, we find the parabola, shown below, at the left. Now let’s look at a different function, the sine wave, which is plotted below on the right. These two functions are very different, and yet they share enough of their shape in common that iterating the sine function in the complex plane and mapping the fates of the starting values creates a fractal image… that contains small replicas of the Mandelbrot Set!REF
Let’s see some examples! Below you can see the fractal generated by iterating the equation: 
On the left is the big view of the fractal image, and on the right is a zoomed in detail, showing one of the infinite number of Mandelbrot replicas in this fractal. 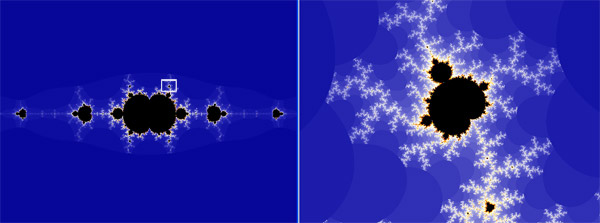 Fractal generated with a sinusoidal function, showing a Mandelbrot Set replica. Let’s look at another example. This next fractal has been called the ‘Nova’ fractal, and it is generated by iterating the equation: 
On the left is the big view of the Nova fractal, and on the right is a zoomed-in detail, showing a perfect Mandelbrot replica. 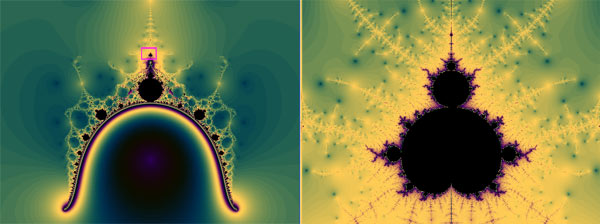 The Nova fractal, discovered by fractal explorer Paul Derbyshire.
Finally, let’s examine the “Magnet” fractal, which is particularly interesting, because it comes from an equation in physics that describes the way in which metals such as iron can gain or lose their magnetism. The equation is: 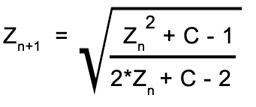
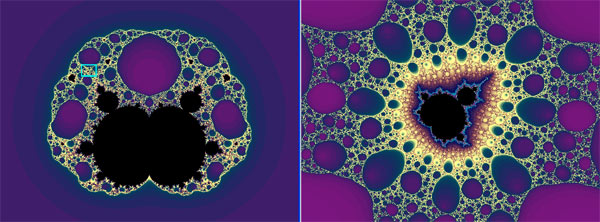 “Magnet” Fractal generated with a function describing the phenomenon known as magnetic percolation. As if the Mandelbrot Set itself were not an infinite enough playground to explore, we now have thousands of other formulas to play with that generate a dazzling variety of fractal forms! Now we are going to explore what happens if we start with Z0 not equal to 0. Play with the applet a bit to explore what happens when you change the value of Z0. You can click to zoom into the image after you’ve adjusted the value of Z0 to see up close how the Mandelbrot Set changes. It can be very informative when studying a complex dynamic system such as this one to see how it responds to small changes in the starting conditions. In this case, we are “perturbing” the normal state of the system by giving Z0 a little nudge in one direction or another. Drag the sliders to adjust the starting value Z0. Click to zoom in <Ctrl>-click to zoom out. Observe how sensitive the Mandelbrot Set is to perturbations of the value of Z0. The normal Mandelbrot Set is a single connected object. However, as soon as we start to perturb Z0, the Set breaks apart and little disconnected islands form. Try perturbing one slider or the other, and notice the different effects of real vs imaginary perturbations. In one case, the resulting Mandelbrot Set preserves its symmetry, but in the other case it does not. We have now seen several examples of Sensitivity to Initial Conditions, in which small changes to the starting conditions can cause big changes in the outcome. In the next section, we’ll see a different phenomenon, Robustness, which is a kind of stability. It means that the equation can be changed significantly, and yet it will still create a map in the complex plane that contains perfect replicas of the Mandelbrot Set. |

